The Dance of Time
In the realm of numbers and data,
Where time holds its infinite sway,
Kalman filters gracefully glide,
To unravel the secrets time hides.
Like dancers in a symphony grand,
They harmonize with time's command,
Filtering noise, finding the truth,
In time series, from aged to youth.
With state space models as their guide,
Kalman filters see what's implied,
They predict and correct with precision,
Unveiling the patterns time envisions.
Time series analysis, a voyage profound,
Unveiling the mysteries, astound,
Through peaks and troughs, they lead the way,
Guiding us through time's rhythmic ballet.
So let us learn, explore, and dive,
Into the depths where time's waves thrive,
With Kalman filters as our companion,
We unlock the secrets time has hidden.

Time Series Lab Software
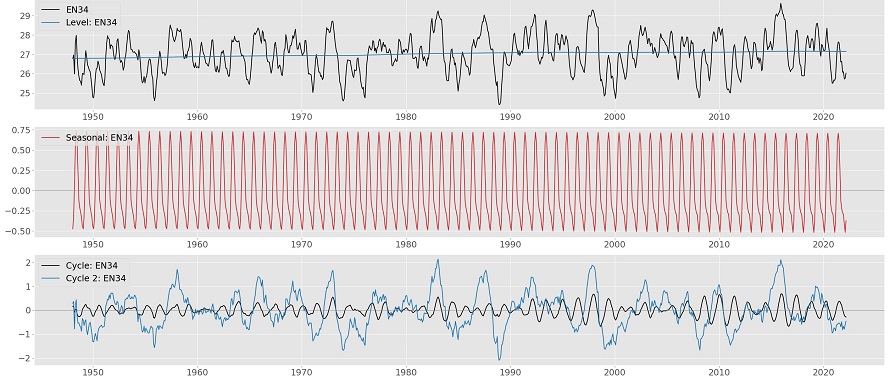
Time Series Lab is a software program designed to model and forecast time series. You can choose from a range of time series models, for example, Exponential Smoothing, ARIMA models, Score-driven models, and State Space models. The models of Time Series Lab use advanced techniques but are designed to be easy to use. At the most basic level all that is required is some appreciation of the concepts of trend and seasonal. The hard work is done by the program, leaving the user free to concentrate on formulating models and using them to make forecasts.
Time Series Lab Research
The Time Series Lab Article Series is dedicated to applied research performed with Time Series Lab software. The scope of the series includes the analysis and forecasting of a wide range of time series including economics, finance, sports, climatology, biology, engineering, and health science.
Did you analyse an interesting time series with Time Series Lab software? Let us know!
Time Series Lab Consultancy

Time Series Lab offers consultancy services to companies who require data analysis that go beyond what is offered by our software packages. We advise on data analysis methods and implementation of them. Time Series Lab also designs software packages specifically suited to your company.
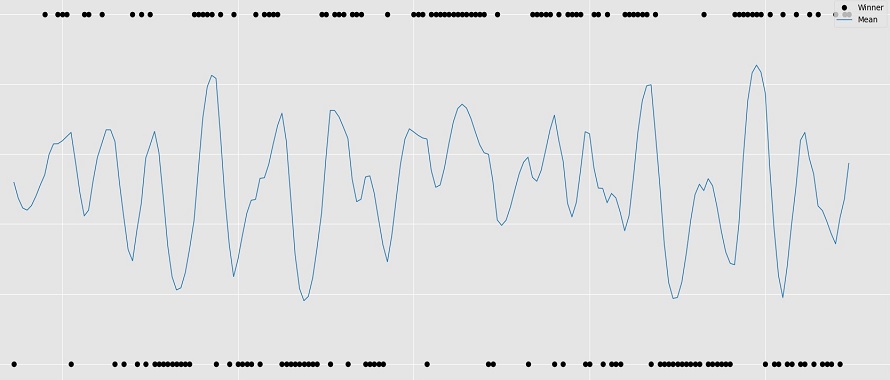
TSL Sports Statistics
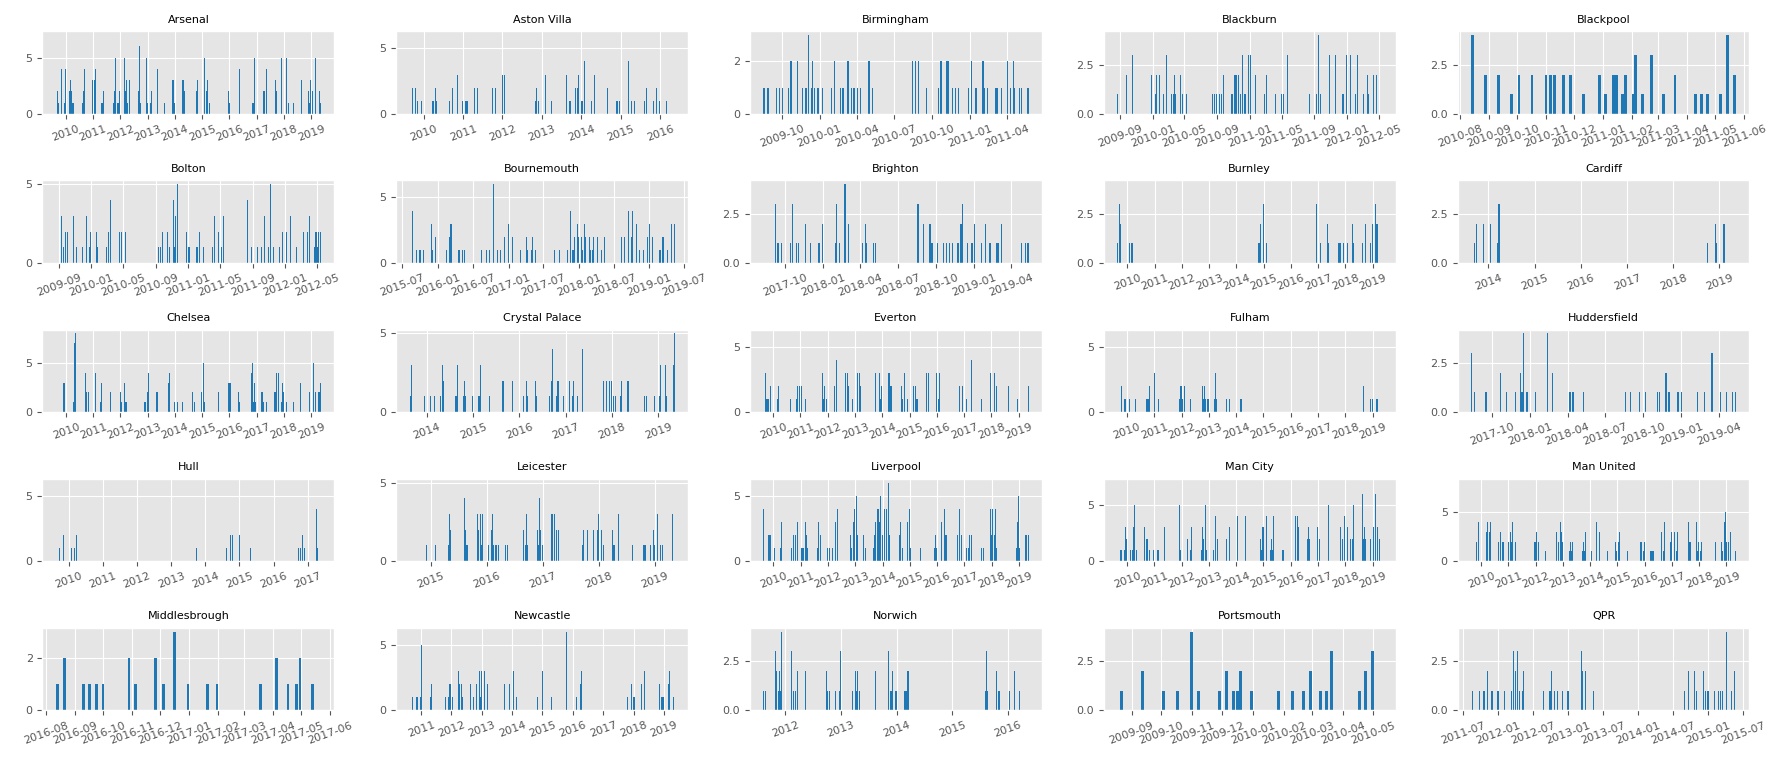
The Time Series Lab team dives into the world of Sports Statistics. We developed a new package called Time Series Lab - Sports Statistics Edition. This is a software program for analysing, modelling, and forecasting of time series focusing on sports results. The software allows you to choose from several probability distributions and model specifications to extract sports team strengths from your data. The software is based on football models that appeared in the academic literature.
Time Series Lab Engine
The engine behind our Time Series Lab software is a set of C routines with the name SsfPack. We pride ourselves in having extremely efficient time series algorithms that result in fast optimisation times even for large systems. When working with large datasets our optimised algorithms are an important asset in keeping estimation times as low as possible.
Time Series Lab
Advanced time series software for inference and forecasting
Main Edition
- Free, even for commercial use*
- Install on standalone pc's for single users or on a Windows terminal server for organisations.
- Many different time series models ranging from basic to expert level
- Batch page to control Time Series Lab without going through the menus.
- Analyse the effect of Explanatory variables on your forecasts
- Compare models on forecasting performance
- Forecast time series with complex seasonal patterns
- Machine learning algorithms for outlier and break detection
- User manual including Case studies to quickly learn how to use Time Series Lab for modelling and forecasting
- Highly efficient code engine
- And much more...
* Time Series Lab should be cited whenever it is used in the following way: Lit, R., S.J. Koopman, and A.C. Harvey (2023), Time Series Lab: https://timeserieslab.com
About Us
Developers with a close connection to academia
R. Lit, PhD
Rutger Lit has a PhD in econometrics, specialising in time series analysis. He is a research fellow at the Vrije Universiteit Amsterdam and Netherlands Institute for the Study of Crime and Law Enforcement. In 2019 he founded Time Series Lab, an advanced time series forecasting package. As of February 2023, he works as Lead Data Scientist at ACMetric.
Short BioProfessor S.J. Koopman
Siem Jan Koopman is Professor of Econometrics at the Department of Econometrics and Data Science, Vrije Universiteit Amsterdam. He is also a research fellow at Tinbergen Institute and a long-term Visiting Professor at CREATES, University of Aarhus.
He held positions at London School of Economics and CentER (Tilburg University), and had long-term visits at US Bureau of the Census, European University Institute, and European Central Bank, Financial Research.
Academic websiteProfessor A.C. Harvey
Andrew Harvey is Emeritus Professor of Econometrics in the Faculty of Economics and Politics, University of Cambridge. He was Professor of Econometrics at the London School of Economics before coming to Cambridge in 1996. His most recent book is a monograph entitled Dynamic Models for Volatility and Heavy Tails. Andrew Harvey is also a Fellow of the Econometric Society and a Fellow of the British Academy.
Academic websiteP. Gorgi, PhD
Paolo Gorgi is Associate Professor at the department of Econometrics and Data Science, Vrije Universiteit Amsterdam. He obtained a double PhD in statistics and econometrics from the University of Padova and Vrije Universiteit Amsterdam. His main research interests concern: time series analysis, statistical inference for dynamic models and forecasting economic variables. He has published articles in several academic journals, including Journal of the Royal Statistical Society: Series B and Journal of Econometrics.
Academic website